Weekly Trader's Outlook
Stocks Hold Their Ground Despite Breakdown in U.S./Iran Relations

The Week That Was
If you read last week's blog, you might recall that I had a "Higher Volatility" forecast for the overall market, with a cautious stance on the technology sector this week. My caution around the tech sector stemmed from the last week's selloff in the Philadelphia (PHLX) Semiconductor Index (SOX), which had a bumpy week, but ultimately appears to have found some near-term support around its 50-day SMA (more on this in the "Technical Take" section below). Markets also experienced some midweek volatility following several attacks in the Strait of Hormuz (by both sides) and President Donald Trump's announcement that the U.S./Iran ceasefire is over. Oil prices and Treasury yields rose this week, and the Cboe Volatility Index (VIX) nearly hit 19 on Wednesday (though it is back down to 15.25 today). Although a high level of uncertainty remains around Iran and whether traffic will resume through the Strait, oil prices have remained relatively behaved (August futures on WTI crude last seen trading down $0.49 to $71.59/barrel). My sense is that as long as oil prices remain subdued, on a near-term basis, investors will mostly focus on the economy and Q2 earnings season which kicks off next week. Having said that, the longer the Iran conflict persists, the higher the likelihood that oil prices trend higher, which theoretically increases the likelihood of rate hikes from the Federal Reserve.
Outlook for Next Week
At the time of this writing (3:15 p.m. ET) stocks are higher and near the highs of the session (DJI + 210, SPX + 33, $COMP + 87, RUT - 35), as investors may be adding to long positions in anticipation of Q2 earnings season which begins next week. FactSet is currently forecasting a healthy 23.3% year-over-year (YoY) earnings growth for the S&P 500 in the second quarter. Next week, we are not only going to hear from the big banks on Tuesday and Wednesday, but we'll also hear from chip equipment maker ASML on Wednesday and Taiwan Semiconductor (TSM) on Thursday. Markets will also have a lot to monitor on the economic calendar as well. Not only will we get the monthly Consumer Price Index (CPI) report on Tuesday morning, but Fed Chair Kevin Warsh will deliver his first semiannual testimony before Congress at 10:00 a.m. ET that day. Then, the monthly wholesale report (Producer Price Index, or PPI) will come out on Wednesday, and the monthly retail sales report will come out on Thursday. And then there's the status of the U.S./Iran negotiations. While Trump said that the ceasefire is over, both sides have agreed to continue indirect talks facilitated by Qatar, but the probability of reaching a resolution looks poor, given the exchange of attacks that took place this week. Technically, the S&P 500 looks bullish (on track to close at a three-week high today), as does the S&P 500 Equal Weight (which bounced firmly off its 20-day Simple Moving Average, or SMA), but the PHLX Semiconductor Index (SOX) still has to prove itself next week (it bounced off the 50-day SMA this week, but the price action is choppy, not a "V" bounce off support). If the chips stocks fail to hold up next week, it's possible that money will simply rotate to other areas of the market, but it could also shake investor confidence. Lastly, there's seasonality, which is bullish in the month of July and earnings season could reinforce the notion of a strong fundamental backdrop. Taking everything into consideration, I'll provide a "Slightly Bullish" forecast for the overall market next week, while acknowledging the potential for "Higher Volatility," given the slew of potential catalysts next week. What could challenge my Slightly Bullish forecast? A jump in oil prices or a jump in yields, either due to higher oil or a more hawkish Warsh (given the cancellation of the ceasefire), could lead to down week for stocks.
Other Potential Market-Moving Catalysts
Economic:
- Monday (July 13): Treasury Budget
- Tuesday (July 14): Consumer Price Index (CPI), Net Long-Term TIC Flows
- Wednesday (July 15): Producer Price Index (PPI), EIA Crude Oil Inventories, Empire State Manufacturing, MBA Mortgage Applications Index
- Thursday (July 16): Business Inventories, Continuing Claims, EIA Natural Gas Inventories, Initial Claims, NAHB Housing Market Index, Pending Home Sales, Philadelphia Fed Index
- Friday (July 17): Building Permits, Capacity Utilization, Export Prices, Housing Starts, Import Prices, Industrial Production, University of Michigan Consumer Sentiment - Preliminary
Earnings:
- Monday (July 13): FB Financial Corp. (FBK), Grupo Aeromexico SAB de CV
- Tuesday (July 14): Aehr Test Systems (AEHR), Bank of America Corp. (BAC), Citigroup Inc. (C), Fastenal Co. (FAST), Goldman Sachs Group Inc. (GS), JPMorgan Chase & Co. (JPM), Wells Fargo & Co. (WFC)
- Wednesday (July 15): ASML Holding NV (ASML), Bank of New York Mellon Corp. (BNY), BlackRock Inc. (BLK), Cintas Corp. (CTAS), Elevance Health Inc. (ELV), J.B. Hunt Trasport Services Inc. (JBHT), Johnson & Johnsons (JNJ), Kinder Morgan Inc. (KMI), Morgan Stanley (MS), PNC Financial Services Group (PNC), Progressive Corp. (PGR), United Airlines Holdings (UAL)
- Thursday (July 16): Abbott Laboratories (ABT), Alcoa Corp. (AA), Citizens Financial Group Inc. (CFG), GE Aerospace (GE), Intuitive Surgical (ISRG), Netflix Inc. (NFLX), Prologis Inc. (PLD), State Street Corp. (STT), Taiwan Semiconductor Manufacturing (TSM), UnitedHealth Group Inc. (UNH), US Bancorp. (USB)
- Friday (July 17): Autoliv Inc. (ALV), Fifth Third Bancorp. (FITB), Regions Financial Corp. (RF), Travelers Companies Inc. (TRV), Truist Financial Corp. (TFC)
Economic Data, Rates & the Fed
It was a light week on the economic calendar, which was highlighted by the June Federal Open Market Committee (FOMC) meeting minutes along with a few reads on the U.S. services sector. The FOMC minutes didn't really provide any surprises, and perhaps that should have been expected given Warsh's stance on Fed communication. Regardless, since the June meeting the U.S./Iran ceasefire has been cancelled and oil prices have ticked higher, which isn't conducive for the Fed's price stability goal. On the services reports from ISM and S&P Global, both indexes remained in expansionary territory, which suggests healthy business activity. Here's a breakdown of the reports:
- FOMC Minutes (June Meeting): The meeting summary was scant on details around forward guidance, which was perhaps not a surprise given Fed Chair Kevin Warsh's desire to reduce Fed communication to the public. The committee was split between holding the fed funds rate steady and raising them at least once this year, however a "few participants" said that there was already enough evidence to hike at the June 16-17 meeting. The was a near unanimous view that a rate hike would be necessary if higher inflation persisted. From the minutes: "Participants generally assessed that information received over the inter-meeting period suggested that upside risks to price stability remained elevated while downside risks to achieving maximum employment had moderated a bit."
- ISM Non-Manufacturing Index: Decreased to 54.0% in June from 54.5% in May, which was in line with estimates. The slight deceleration was driven by a slowdown in business activity growth (55.4 vs. 57.7) and new orders (55.1 vs. 57.3). The Prices Index decreased to a four-month low of 67.7 in June from 71.3 in May.
- S&P Global U.S. Services PMI: Rose to 51.2 in June from 50.7 in May, which was just below the 51.3 economists were expecting.
- Existing Home Sales: Declined to 4.09M from 4.17M in the prior month and below the 4.20M economists were expecting.
- Wholesale Inventories: 0.1% vs. 0.2% est.
- EIA Crude Oil Inventories: +3.00M barrels.
- EIA Natural Gas Inventories: +61 bcf.
- Initial Jobless Claims: Initial applications for U.S. jobless benefits decreased 2K from last week's (upwardly revised) 217K to 215K, which was below the 220K economists had expected. Continuing Claims ticked up 8K from the prior week to a seasonally adjusted 1.81M.
- The Atlanta Fed's GDPNow "nowcast" for Q2 GDP was revised up slightly to 1.3% on Wednesday from 1.2% last Friday.
U.S. Treasuries increased across the board this week, which was driven by the ceasefire cancellation and subsequent move higher in oil prices. Compared to last Friday, two-year Treasury yields moved up ~7 basis points (4.204% vs. 4.137%), while 10-year yields (4.561% vs. 4.485%) and 30-year yields (5.068% vs. 4.985%) both increased ~8 basis points.
Market expectations around a potential rate hike from the Federal Reserve moved back up this week, primarily driven by the U.S./Iran breakdown in negotiations and subsequent push higher in oil prices. Per the Bloomberg rate probabilities, the probability of a rate hike at the July FOMC is now up to 31% from 17% and September FOMC has moved up to 84% from 61% (both week-over-week). The first theoretical 100% probability of a rate hike has moved up to the October FOMC meeting from December.
Technical Take
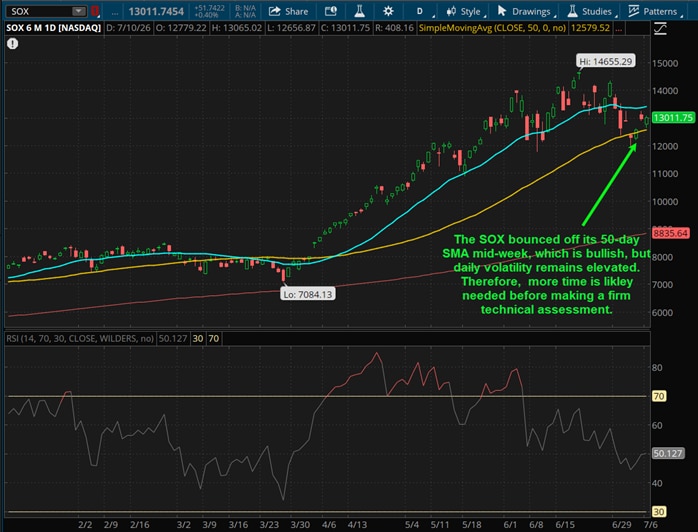
PHLX Semiconductor Index (SOX + 51 to 13,011)
Last week, I noted that the PHLX Semiconductor Index (SOX) was oversold on a very near-term basis and to be on watch for an oversold bounce. On Monday of this week, the SOX snapped back and at one point was up 4.95% on the day before closing up just 2.1%. However, the index dropped over 4% on Tuesday, closing just below its 50-day Simple Moving Average (SMA) for the first time since early April. On Wednesday, fortunately for the bulls, the dip buyers stepped in and pushed the SOX back above its 50-day SMA by the close. If you are bullish, it's important to see this kind of support hold up in an uptrend, as the bounce rewards the dip buyers (which reinforces future dip buying behavior, at least theoretically) and helps embolden investor confidence. So, what now, from a technical perspective? If you are bullish, ideally you would want to see follow-through upward movement off the support bounce over the coming days/weeks. The SOX has held above its 50-day SMA over the past 48 hours which is encouraging (and net bullish), but we probably need a few more trading sessions to have a better sense of just how reliable support at the 50-day SMA is in my view. Today, high bandwidth memory giant SK Hynix (ticker: SKHYV) made its US public market debut and it was well received by investors, climbing 14% above tis offer price of $149/ADR. I'm not sure whether SKHYV's debut created some selling of other chip stocks to raise funds, or whether the additional memory stock will weigh down the SOX, so I'm reserving judgement until I see a few more trading days. For now, the technicals appear to be slightly bullish on the SOX for now (since the index is holding above its 50-day SMA), but keep in mind that the index nearly tested its 50-day SMA once again this morning, so I'd expect day-to-day volatility in the chip space to persist in the near-term.
Near-term technical translation: slightly bullish
Source: ThinkorSwim trading platform
Past performance is no guarantee of future results.
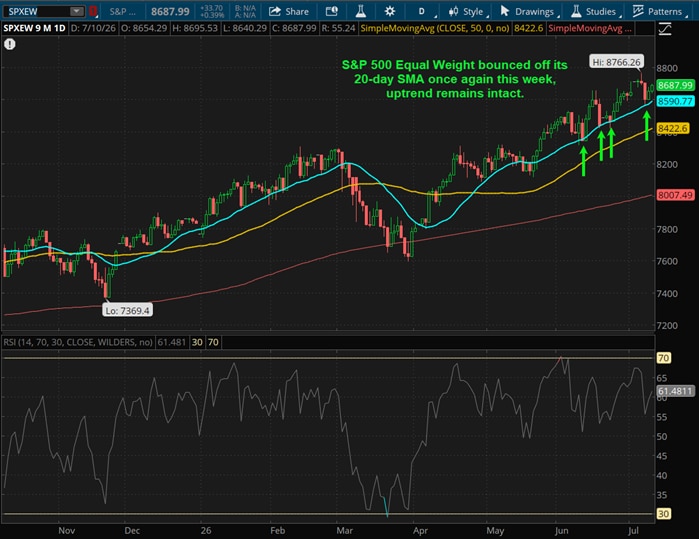
S&P Equal Weight Index (SPXEW + 33 to 8,687)
Last week I had a near-term "neutral" technical assessment on the S&P Equal Weight index (SPXEW), noting that a pullback to the 20-day SMA wouldn't surprise me. On Wednesday the index did just that, and it subsequently bounced, which is exactly what the bulls like to see in a healthy uptrend. Therefore, the 20-day SMA remains as near-term support, and assuming the uptrend remains true to form, one would expect a new all-time high in the near-term.
Near-term technical translation: bullish
Source: ThinkorSwim trading platform
Past performance is no guarantee of future results.
Cryptocurrency News
The Bitwise 10 Large Crypto Index is up 1% since last Friday, with bitcoin up 1% and ether down 1% at the time of writing. While not making broad investor or news headlines, within the bitcoin community a contentious debate is unfolding around Bitcoin Improvement Proposal (BIP) 110. A BIP is a formal proposal to change the Bitcoin protocol. Any proposal must achieve broad consensus to be adopted, which constitutes an incredibly high bar for changes. BIPs are typically proposed by developers, but adoption ultimately depends on consensus among developers, miners, node operators, exchanges, custodians, businesses, and users. Historically, many consensus-rule changes have used miner signaling thresholds, often 95%, though activation mechanisms have varied across proposals.
BIP 110 would create a temporary one-year soft fork in the blockchain, restricting most known methods of embedding large amounts of non-monetary data into Bitcoin transactions, while preserving standard monetary uses of Bitcoin. Proponents of this change argue that block space should be primarily used for monetary settlement, and arbitrary data storage competes with payments for block space. Opponents object to it because if a transaction follows the current consensus rules and pays the required fee, then it shouldn't be penalized. There is also a subjective distinction when distinguishing between "financial" and "non-financial" use cases.
The key risk, which is why many oppose this BIP, is that a user-activated soft fork that lacks miner support could increase the risk of a chain split. Rather than a hard fork (which created other versions of bitcoin such as Bitcoin Cash and Bitcoin SV), this soft fork could result in a scenario where exchanges, custodians, miners and users temporarily disagree on the primary bitcoin blockchain, potentially creating settlement uncertainty, operational disruption and market volatility.
August 7th is the key date in this BIP process. Prior to August 7th, miners could voluntarily signal support and help reach the activation threshold. August 7th marks the beginning of the proposal's mandatory signaling and enforcement window. Current estimates suggest that approximately 1% of network hashrate is signaling support for the proposal, but adding to the contention, this proposal only requires 55% miner consensus to be enacted, compared to most BIPs which require 95%.
This is unlikely to create a situation where the Bitcoin blockchain fails, but in the worst case could create the potential for short-term market volatility and operational disruption if different segments of the ecosystem disagree on activation. This is ultimately more of a governance dispute than a direct threat to Bitcoin's security or monetary properties.
Major Bitcoin Protocol Update Milestones
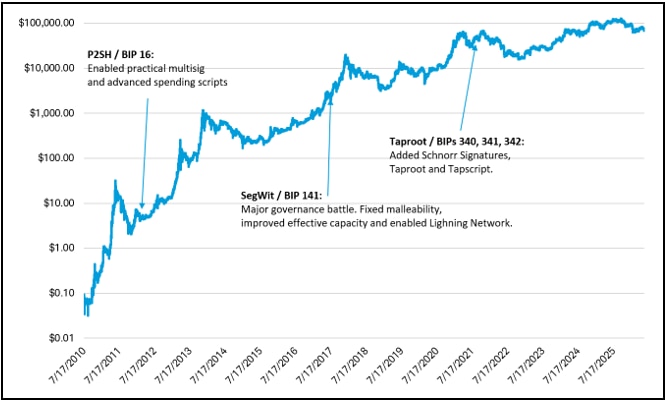
Source: Glassnode, Schwab
Jim Ferraioli , Director of Digital Currencies Research and Strategy, authored this report.
Market Breadth
The Bloomberg chart below shows the current percentage of members within the S&P 500 (SPX), Nasdaq Composite (CCMP), and Russell 2000 (RTY) that are trading above their respective 200-day Simple Moving Averages (SMA). In short, the SPX and CCMP moved modestly higher this week, while the RUT declined slightly, yes market breadth firmly held up. Both the SPX and RUT notched fresh four-month highs in market breadth earlier this week. Compared to last Friday, the SPX (white line) breadth moved up to 65.33% from 63.92%, the CCMP (blue line) eased to 48.45% vs. 49.02%, while the RUT (red line) is essentially flat at 67.27% versus 67.98% (all week-over-week).
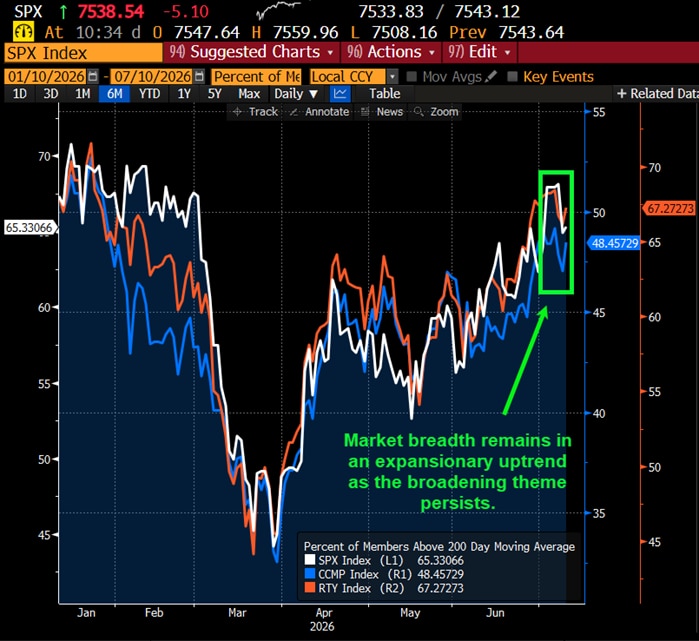
Source: Bloomberg L.P.
Market breadth attempts to capture individual stock participation within an overall index, which can help convey underlying strength or weakness of a move or trend. Typically, broader participation suggests healthy investor sentiment and supportive technicals. There are many data points to help convey market breadth, such as advancing vs. declining issues, percentage of stocks within an index that are above or below a longer-term moving average, or new highs vs. new lows.
This Week's Notable 52-week Highs (77 today): Ascendis Pharma Inc. (ASND - $4.79 to $270.64), Beazer Homes Inc. (BZH + $0.64 to $32.05), Glaukos Corp. (GKOS + $0.29 to $155.36), Marathon Petroleum Corp. (MPC - $0.01 to $283.29), UnitedHealth Group Inc. (UNH - $4.80 to $426.87), Valero Energy Corp. (VLO + $2.48 to $283.73)
This Week's Notable 52-week Lows (25 today): Aecom Technology Corp. (ACM + $0.01 to $68.06), Dolby Laboratories Inc. (DLB + $0.23 to $50.35), Graco Inc. (GGG + $1.03 to $74.22), Nano Nuclear Energy Inc. (NNE - $0.42 to $18.86), Ollie's Bargain Outlet Holdings Inc. (OLLI + $0.16 to $63.88), QXO Inc. (QXO + $0.17 to $14.75)